Daily Market News - 17th March 2022
Is Tech Ready To Climb Higher?
Let me start this weeks letter by thanking those of you who reached out after last weeks letter, ZIM Integrated Shipping (ZIM) has been a Rockstar over the last week, congrats to those who bought it.
This week, I’m going to put out some charts in the much maligned Technology sectors, but as always, I reserve the right to change my mind on 30 seconds notice if price tells me to, but I’ll lay out those levels below.
Let me also say, Russia / Ukraine / China / Fed / Interest Rate Hikes and any other macro economic event can absolutely tank the market overnight, so having a strong risk management process would seem sensible.
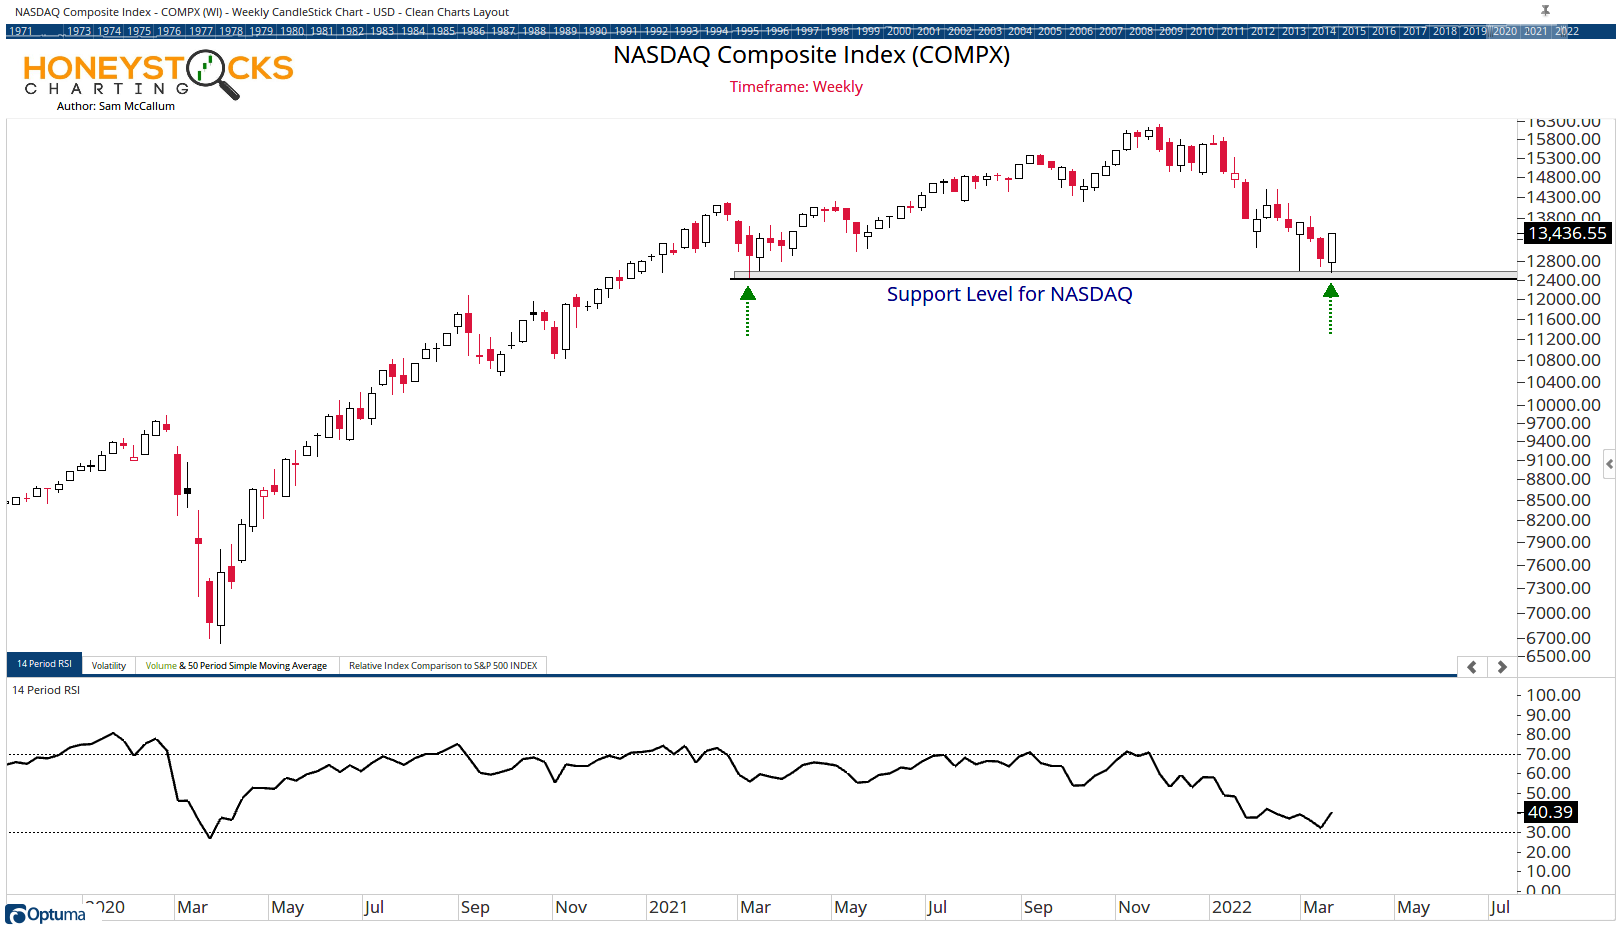
Lets start with the Nasdaq.
Nasdaq Composite Index (COMPX)
I’ve been watching this level in the Nasdaq for signs of support, and over the last 48hrs, the market has respected these levels as hoped. If the Nasdaq is above 12,400, I think the risk : reward proposition favours the bulls. That’s not opinion. That’s price.
A break below 12,400 and it’s likely more carnage… I don’t like it when key levels continually get tested so cautious optimism would be my view.
Invesco QQQ
Let me explain the chart.
I’ve applied a 100 Week Simple Moving Average and Relative Strength Indicator (RSI) and what the chart is essentially saying is that since the 2008 Financial Crisis, we’re approaching a level of RSI oversold where we can reasonably expect some kind of rebound.
My line in the sand would be $300, if we see further declines, I’d hope to see $300 hold.
Below $300 and it’s likely more carnage.
First Cloud Computing ETF (SKYY)
When we’re looking at buying into beaten up areas of the market, it’s never a co-incidence to me how the market respects key Technical Levels and as a market participant, it would be negligent if I didn’t pay attention to that data.
Cloud names have dropped anywhere between 20-70% over the last few months. I think there’s a case to be made for dipping the toes in to some individual names (or the ETF) at current levels.
NVIDIA (NVDA)
I’ve been on top of the this NVDA chart for a while now and highlighting the 50 Week Simple Moving Average as a good buy point historically. Technical Analysis doesn’t have to be complex.
In our premium Half Time Analysis last night I put out another 6 or 7 charts beaten up names with good risk : reward propositions that I think are worth considering, so my work is now starting to look at Tech names again.
Lets hope the market plays ball and resolves higher instead of capitulating.. I much prefer the majority of stocks going up rather than going down. I think we can all agree with that.
I put the below video analysis to Social Media on 19th March. Feel free to check that out if you’re looking for stocks to add to your watchlist.


Our Time Stamped Market Calls