


Daily Market News - 26th Nov

Ethereum Thoughts
Bare with me here. Most of you probably know by now I don’t pay attention to gut feelings or let confirmation bias creep into my thought process, I’m more of a charts/ data guy.
With crypto, despite my Technical approach, I’m also very much a dollar cost average guy (the volatility is too much to keep on top of, so I’ve embraced it).
I also tend to see the world in 1’s and zero’s and by having a data driven approach and paying close attention to the charts, it tends to keep me on the right side of things most of the time.
Today I’m making the case for owning Ethereum and I have a few charts to back it up.
For those that missed my Bitcoin Analysis on 1st October where I laid out some targets there (Target 1was met) - You can FIND THAT HERE
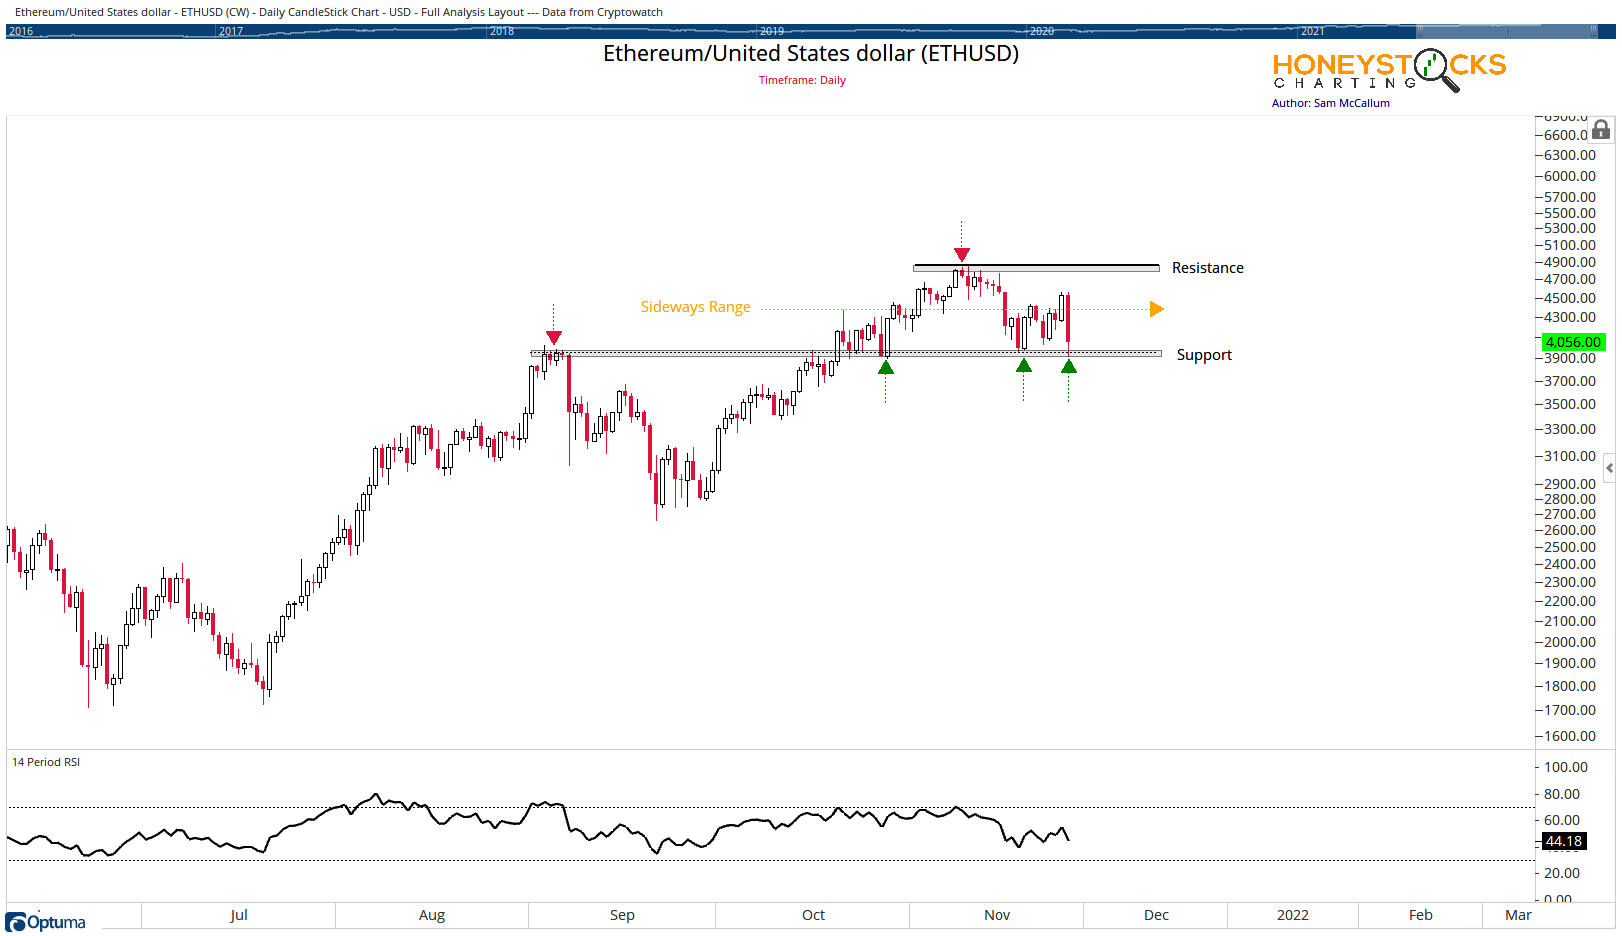
ETH Chart
As we can see, overnight Ethereum has dipped HARD, for anyone not accustomed to the volatile nature of crypto and those who use leverage, it’s likely been a bad start to the day.
The $3900ish level appears to have a little bit of significance and Ethereum is stuck in a sideways range. I don’t mind range bound names, it’s simple, buy at the bottom and sell at the top most of the time, that’s what the text books tells us in Technical Analysis kindergarten.
A break lower and things get very tricky. I mean VERY tricky.
I’m still bullish on Ethereum in the short term, but will happily revisit that thesis in a few hours time if price tells me to.
Ethereum Relative to Bitcoin
The ratio charts are an important part of my work. They help me identify the best stocks in the best sectors for my clients and members and the comparison with Bitcoin is an obvious 1 to make. If we’re going to be allocated to digital assets, it’s common sense to be allocated to the best ones.
As the chart shows, Ethereum is building a base vs Bitcoin, and if it breaks out above this base, there is no debate to be had. Data tells me Ethereum will be out performing Bitcoin, so i’d probably want to own more Ethereum than Bitcoin (at least in the short term)… longer term… that’s a different conversation… but you get the idea.
Price and data take away my feelings on the subject.

If that wasn’t enough, lets look at what price is doing now vs the Parabolic Bitcoin move in 2017.
I don’t expect anyone reading this to fully “get” the chart, or have access to data and tools like this, but this is what is called a historical comparison chart and in short, it’s just showing how Bitcoin and Ethereum have moved over 2017 and 2021 respectively.
As the chart shows, the moves in Ethereum this year are mirroring Bitcoin quite closely. This is something I want to pay attention to.

In Conclusion
Price of course needs to confirm the thesis and what I’m looking for is a break out of the sideways range Ethereum and for it to break out on both an absolute and a relative basis. It’s choppy at best if it continues to move in it’s sideways range.
If it can get that break out above $5000, we might just get that parabolic move like we seen in 2017 with Bitcoin. That’s the hope anyway.
If you enjoyed the read, click the button below and check out our huge Black Friday offer (ends Sunday).
Our Time Stamped Market Calls