Daily Market News - 5th May 2022
Are We Close To A Bottom?
If you’re being whipped around in the stock market storm just now, let me reassure everyone reading this, you’re not alone.
You’re most definitely not alone. It’s not fun, and honestly, it’s exhausting switching between bearish / bullish charts… but that’s the environment.
Some of the smartest folks I know are being whipped around in a tornado, and the question I’m getting most often is something along the lines of “are we close to a bottom Sam"?”
Lets take a look at a few charts and try to figure a few things out.
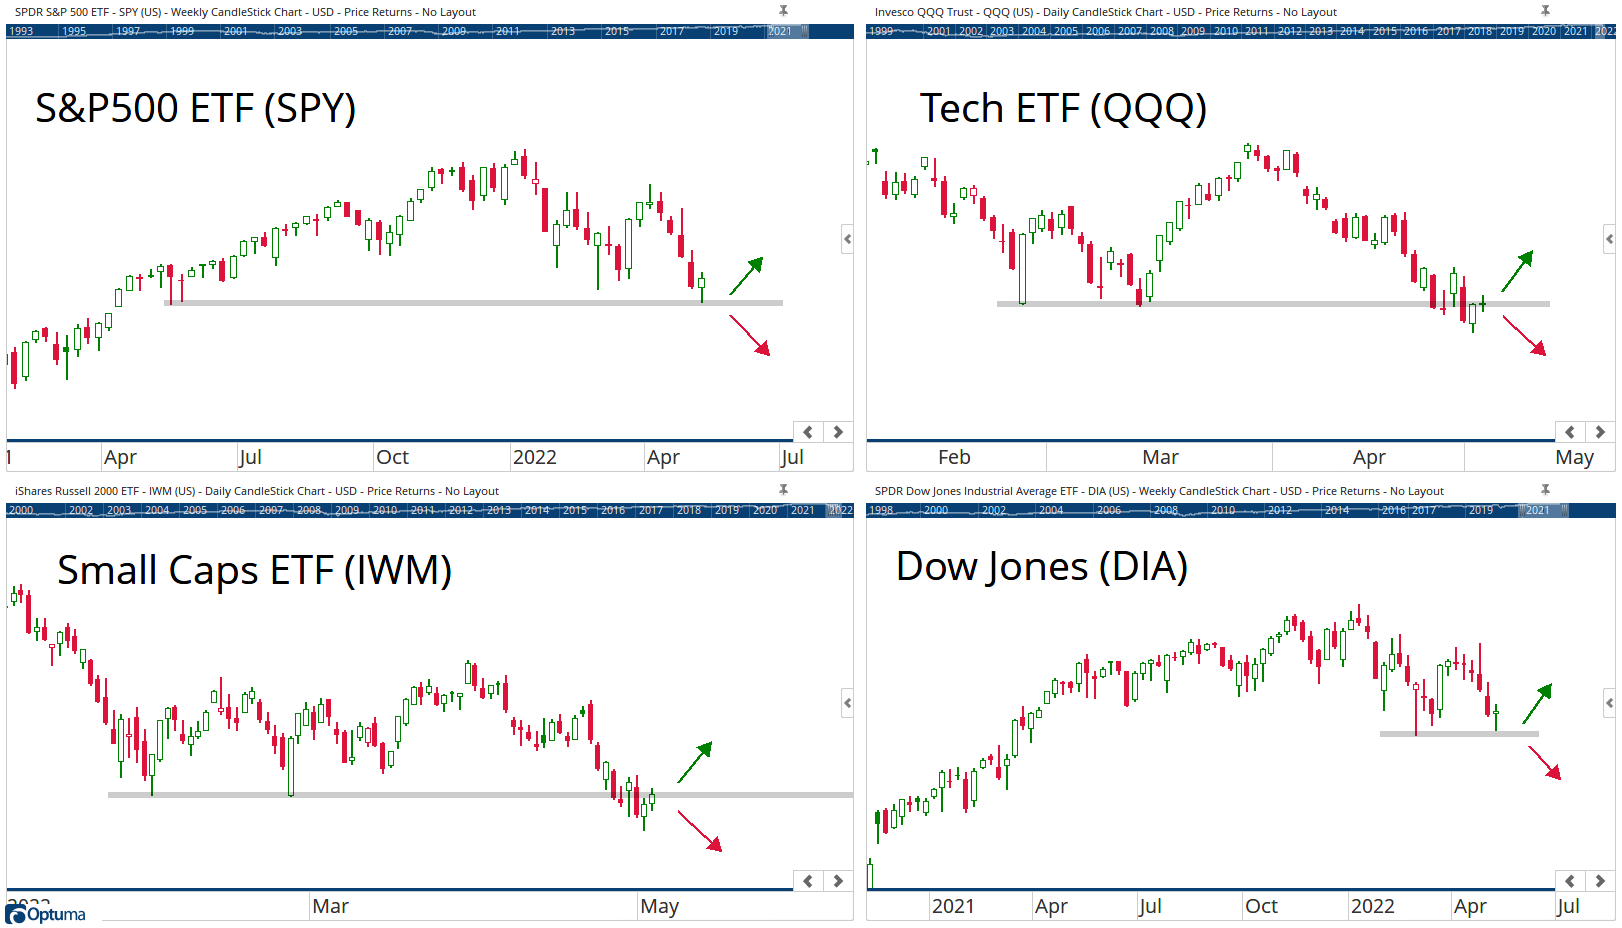
Going into the Fed meeting yesterday, this was the state of play in 4 of the major averages, you may have seen this chart floating about Twitter as it was shared everywhere.
I know, talk about a coincidence.
It’s almost as if the market wanted to place these charts at key Technical levels to create uncertainty.
Lets take a look at the same charts post FOMC.
Let me also share some data with you (data courtesy of the excellent Ryan Detrick CMT (@RyanDetrick - Twitter)
“There have been 24 other corrections for the S&P 500 since WWII. The avg correction was 14.3% and took 133 days. The current correction is 13.9% and up to 117 days.”
As far as corrections go, there’s nothing really out the ordinary and while the pain is shown in the individual stocks more than the major averages, if these key Technical levels in the major averages hold firm and we start to see some kind of breadth expansion (something I’m watching closely)… we could be approaching some kind of tradeable bottom for stocks. That’s the hope.
That said, my message to clients / members over the last few weeks is to assess the chart in front of you for the stocks you want to buy/own… take the eyes off the major averages because there are charts holding up fine and I’ll share a couple of those with you.
Antero Resources (AR)
I’ve been covering this chart for 2years now. Base break out after base break out… text book Technical Analysis… yes, I know it’s recently been helped by the Natural Gas, Russia/Ukraine thing and it’s 1 of very few charts unaffected by the turbulence - but it’s trending and it’s going up.
Williams Cos Inc (WMB)
If you’ve been fixated on buying down trends in Tech, you might have missed the massive moves in Energy and Williams Cos has been holding up very well and was a high conviction idea that went out to members a few weeks ago. As long as it’s above $35, what’s not to like?
Important Point
It’s a tough environment just now and I could absolutely be writing a letter next week hot on the heels of a complete collapse in the market, I’m open to all possibilities because I understand it’s not a moment in time to be aggressively long OR aggressively short. At least that’s how I see it.


Our Time Stamped Market Calls